
IBM Watson Analytics
Overview
In today’s world, data is key in not only understanding human interactions, but also how to make better business decisions fast. With high demand for analytics, there starts to become a complex system for business users and analysts to manage all the different products. From working on multiple tools prior such as natural language processing, interactive dashboards, and predictive visualizations, the team had the backend functionality and system understanding. Through research, we also had a deeper understanding of what needed to change from WA1 to WA2. We were challenged to eliminate the silos of capabilities, make it easy for freemium users to understand, and scale the framework to include the entire portfolio, all while keeping designs consistent and on brand.
Company
IBM
Role
UX Lead,
Contributor
Portfolio
IBM Analytics
Findings
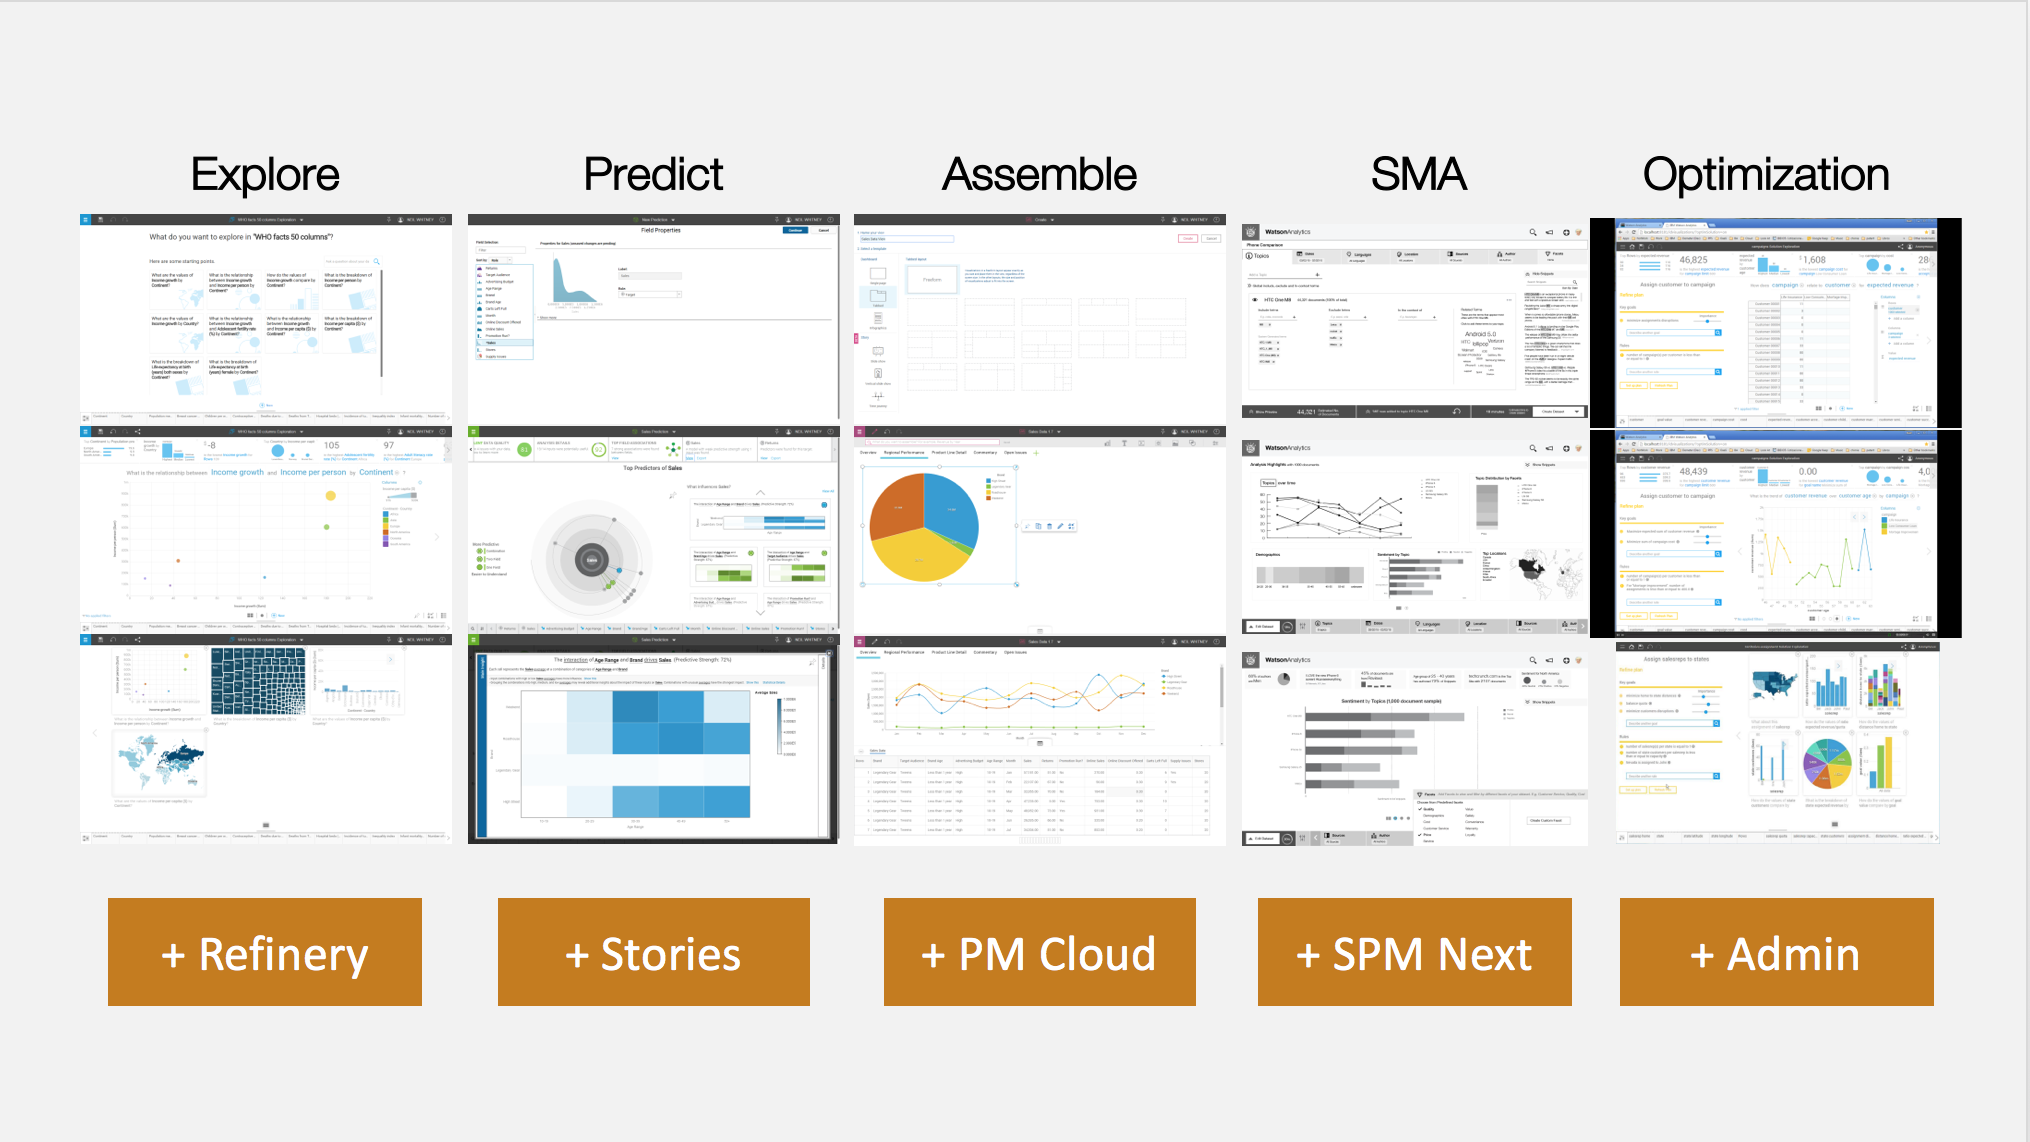
Through research, it was found that many users don’t use Explore / Predict / Assemble their data together. With that understanding, the design framework must scale to include any type of analytics (e.g. visualization, predictive, social media, optimization or operational). To do this, we also realized that improving the digital user experience is an iterative, cross-team effort.
Problems to solve:
Scalable across the portfolio - Consistency - Discovery of new Analytic Paths
Alignment with Mobile Strategy - Simple mental model for users - Eliminate silos
Process
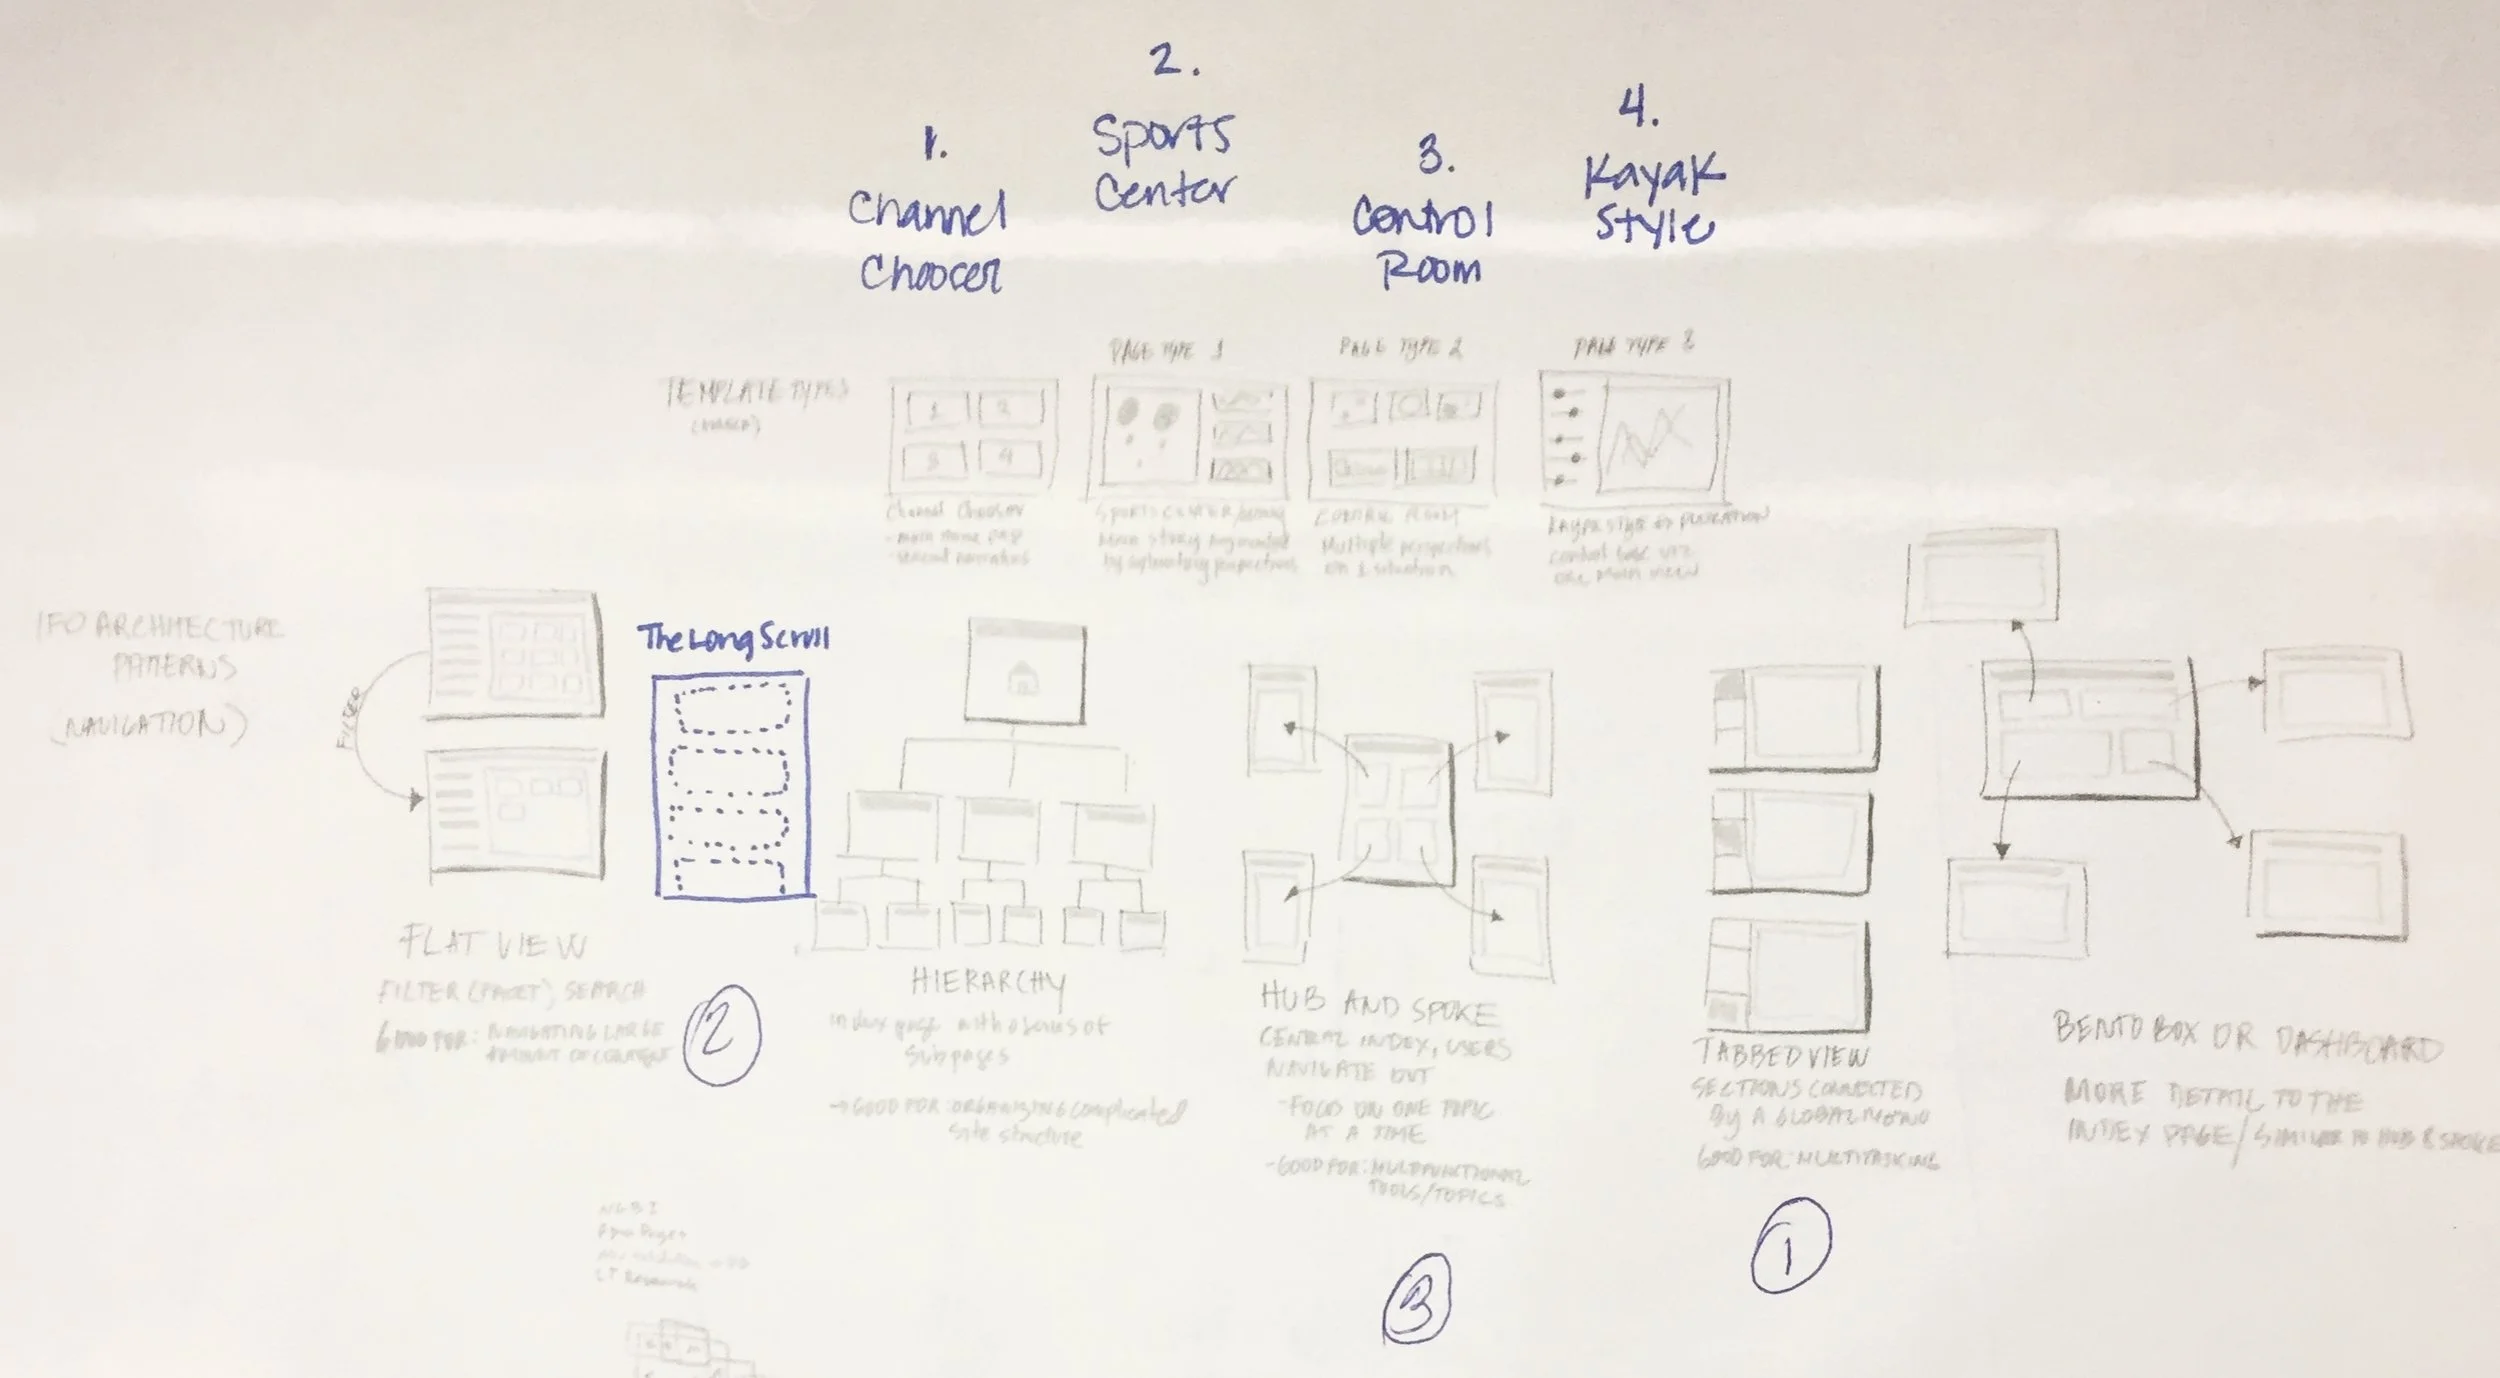
After initial research to deeply understand the problem space, market analysis and target audience, we had a kick off workshop to discuss technical limitations and possibilities. This workshop comprised of lead architects and developers, senior offering managers, and the design leads where we sat around a table and discussed openly and honestly about the integrations of several different platforms.
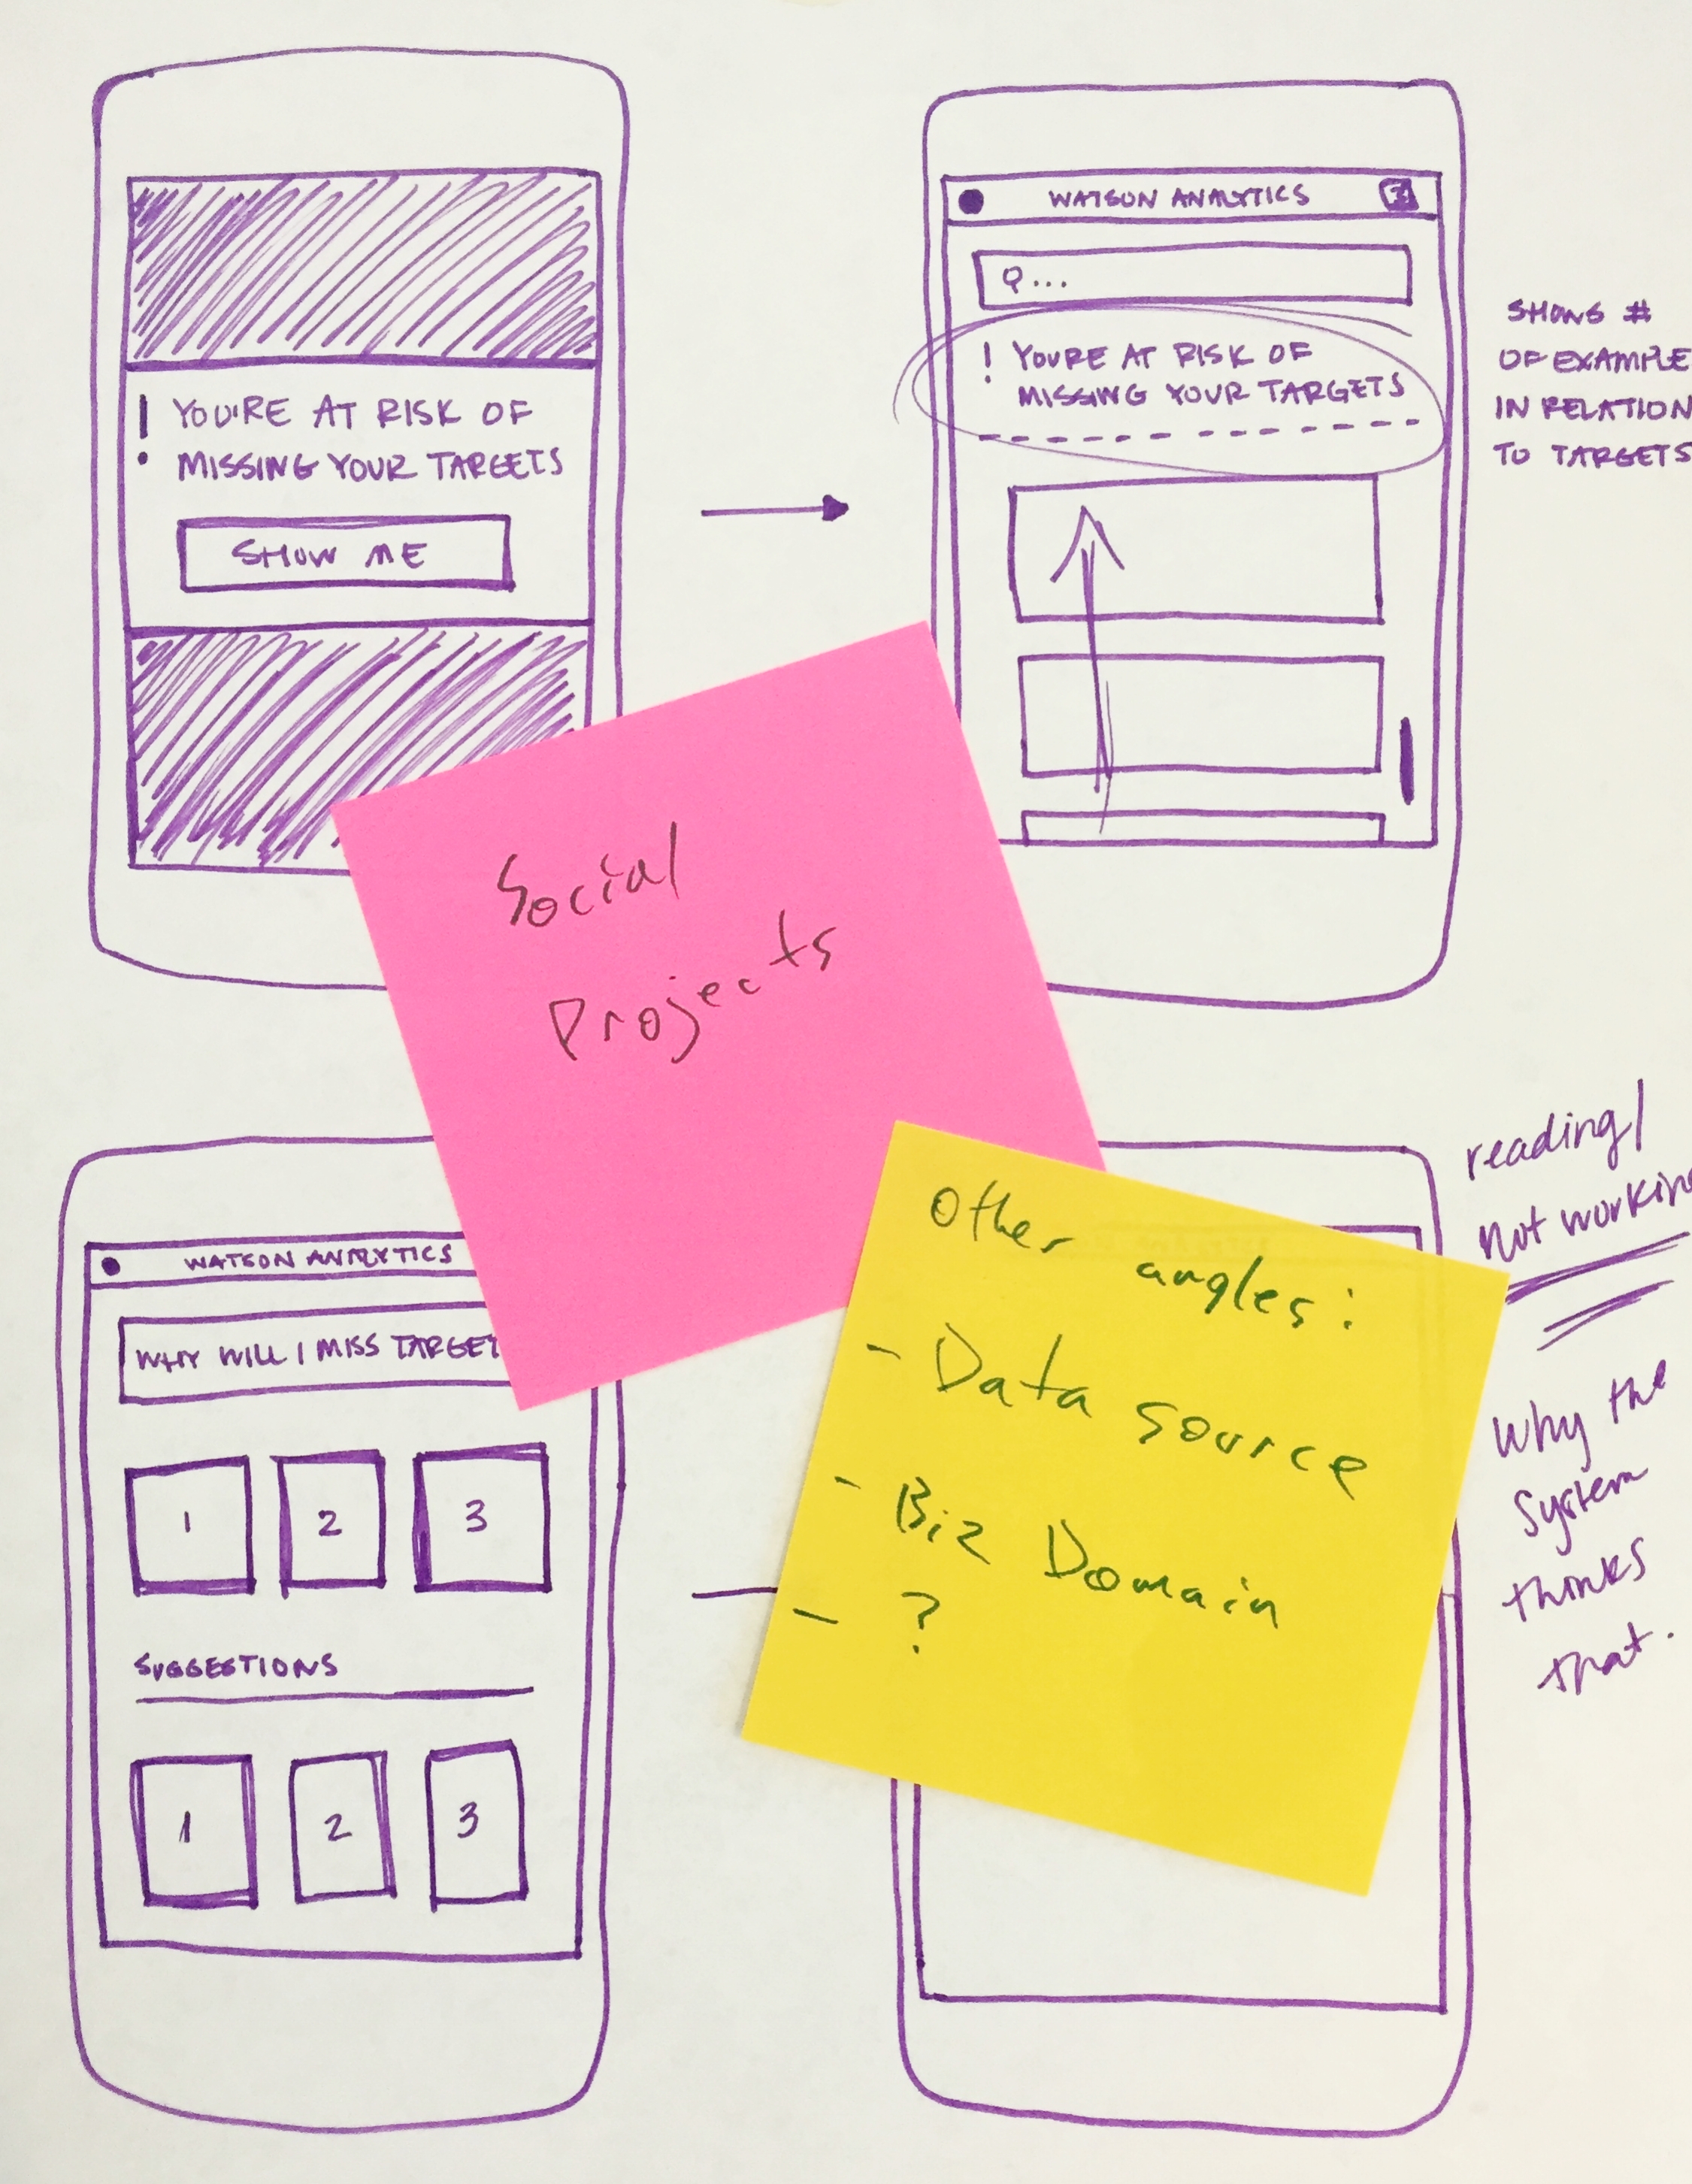
Post planning workshop, the design team got together to start brainstorming and sketching potential ideas and concepts for the new framework. To figure out what are our users paint points, needs and motivations were, we ran through a variety of Design Thinking activities.
At the end of the workshop, we came to an agreement on our overarching goals and split the ownership of the product into 3 major design areas; Data (cleaning), Discover (exploring data), and Display (interactive dashboarding). Moving forward I took responsibility for the Display area, but continued working heavily with rest of the team for consistency in brand and interactions.
Design Goals:
Clear and simple architecture
Consistency across entire user experience
Well integrated solution that is flexible/scalable/reusable
research
We had a fantastic team of researchers that helped shape, Sam, our target user. To help wrap our heads around Sam's activities in our system, we ran a two day Storymapping Workshop. User story mapping is an Agile UX method for creating a visual backlog that provides an overall picture of the activities, tasks and sub-tasks of the targeted users. This enabled our team to share knowledge of the system across the team and promote collaborative input for user stories.


Iterations
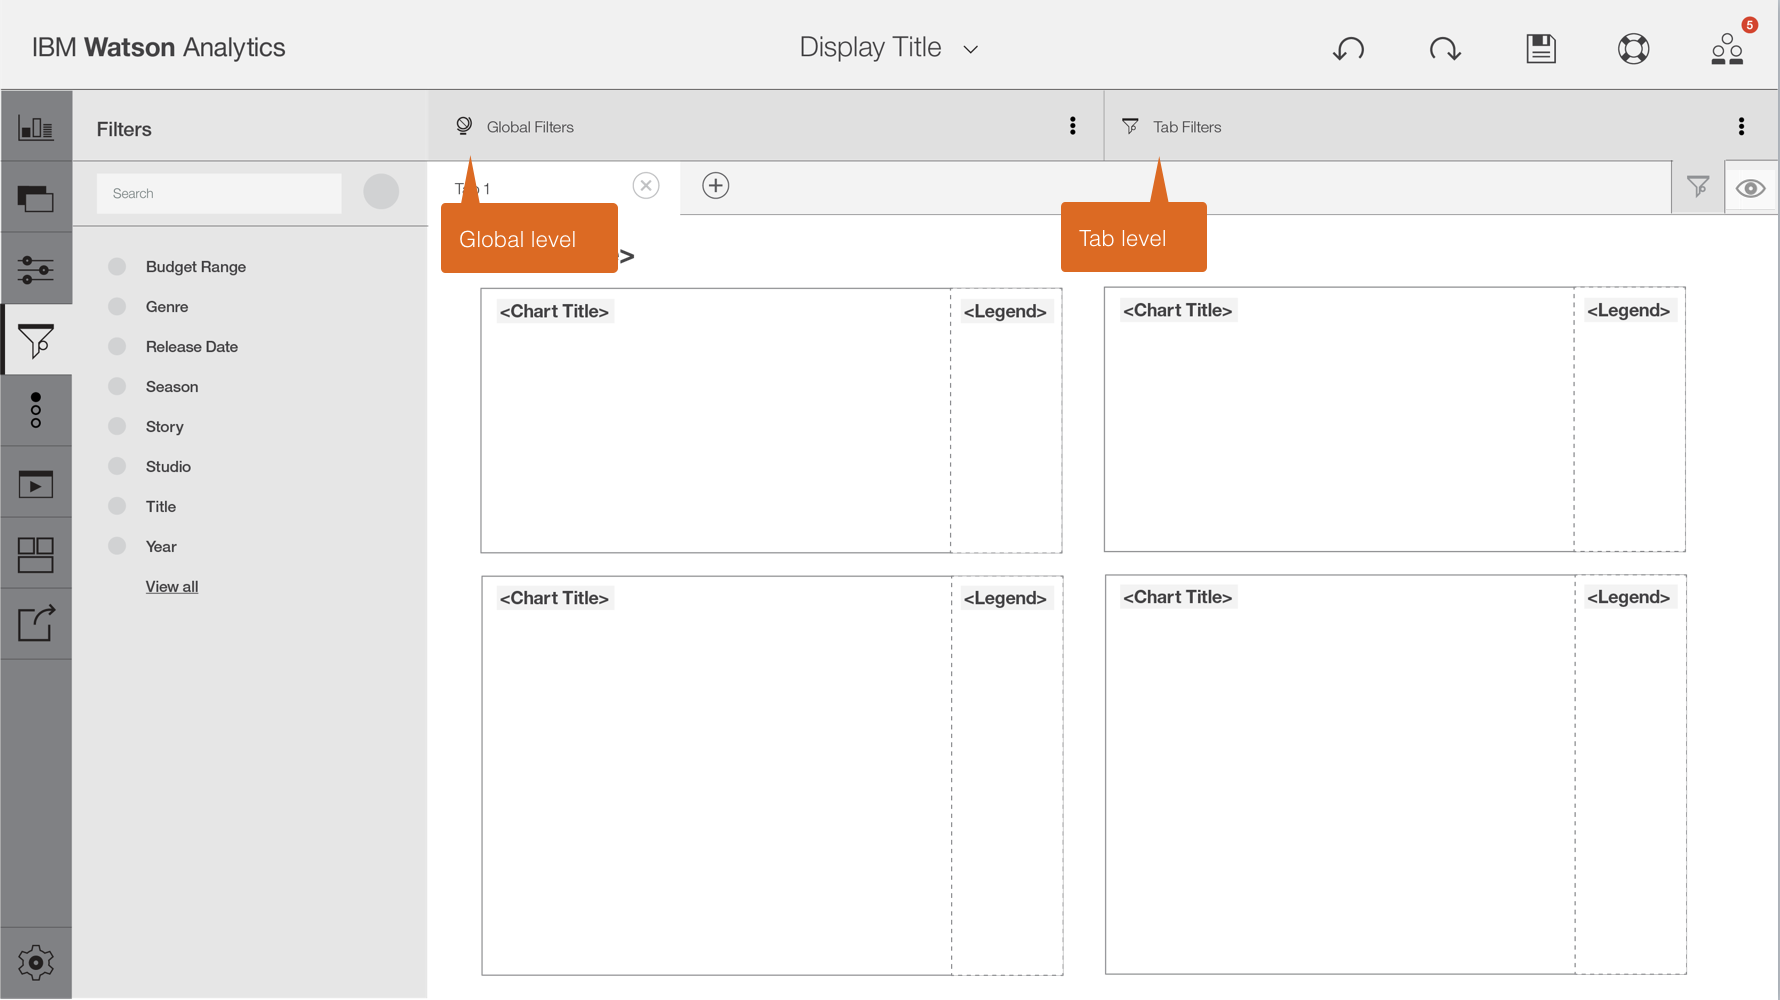
After understanding the capabilities of Display, I spent some time exploring what it meant to display data in an interactive way. This proved to be somewhat tricky since data exploration was mainly done in Discover. Through research we discovered Sam's main intent and needs when accessing a dashboard were: 1) He knows what message he wants to display 2) He wants to be able to insert content from other places 3) He wants to show linkage between multiple cards. With those in mind, I worked heavily with my champion lead architect in defining that experience. Through all of the conversations and designs, keeping Sam's needs in mind:
Make it easy to pull all my findings together - Let me make changes when needed - Help me build a beautiful dashboard


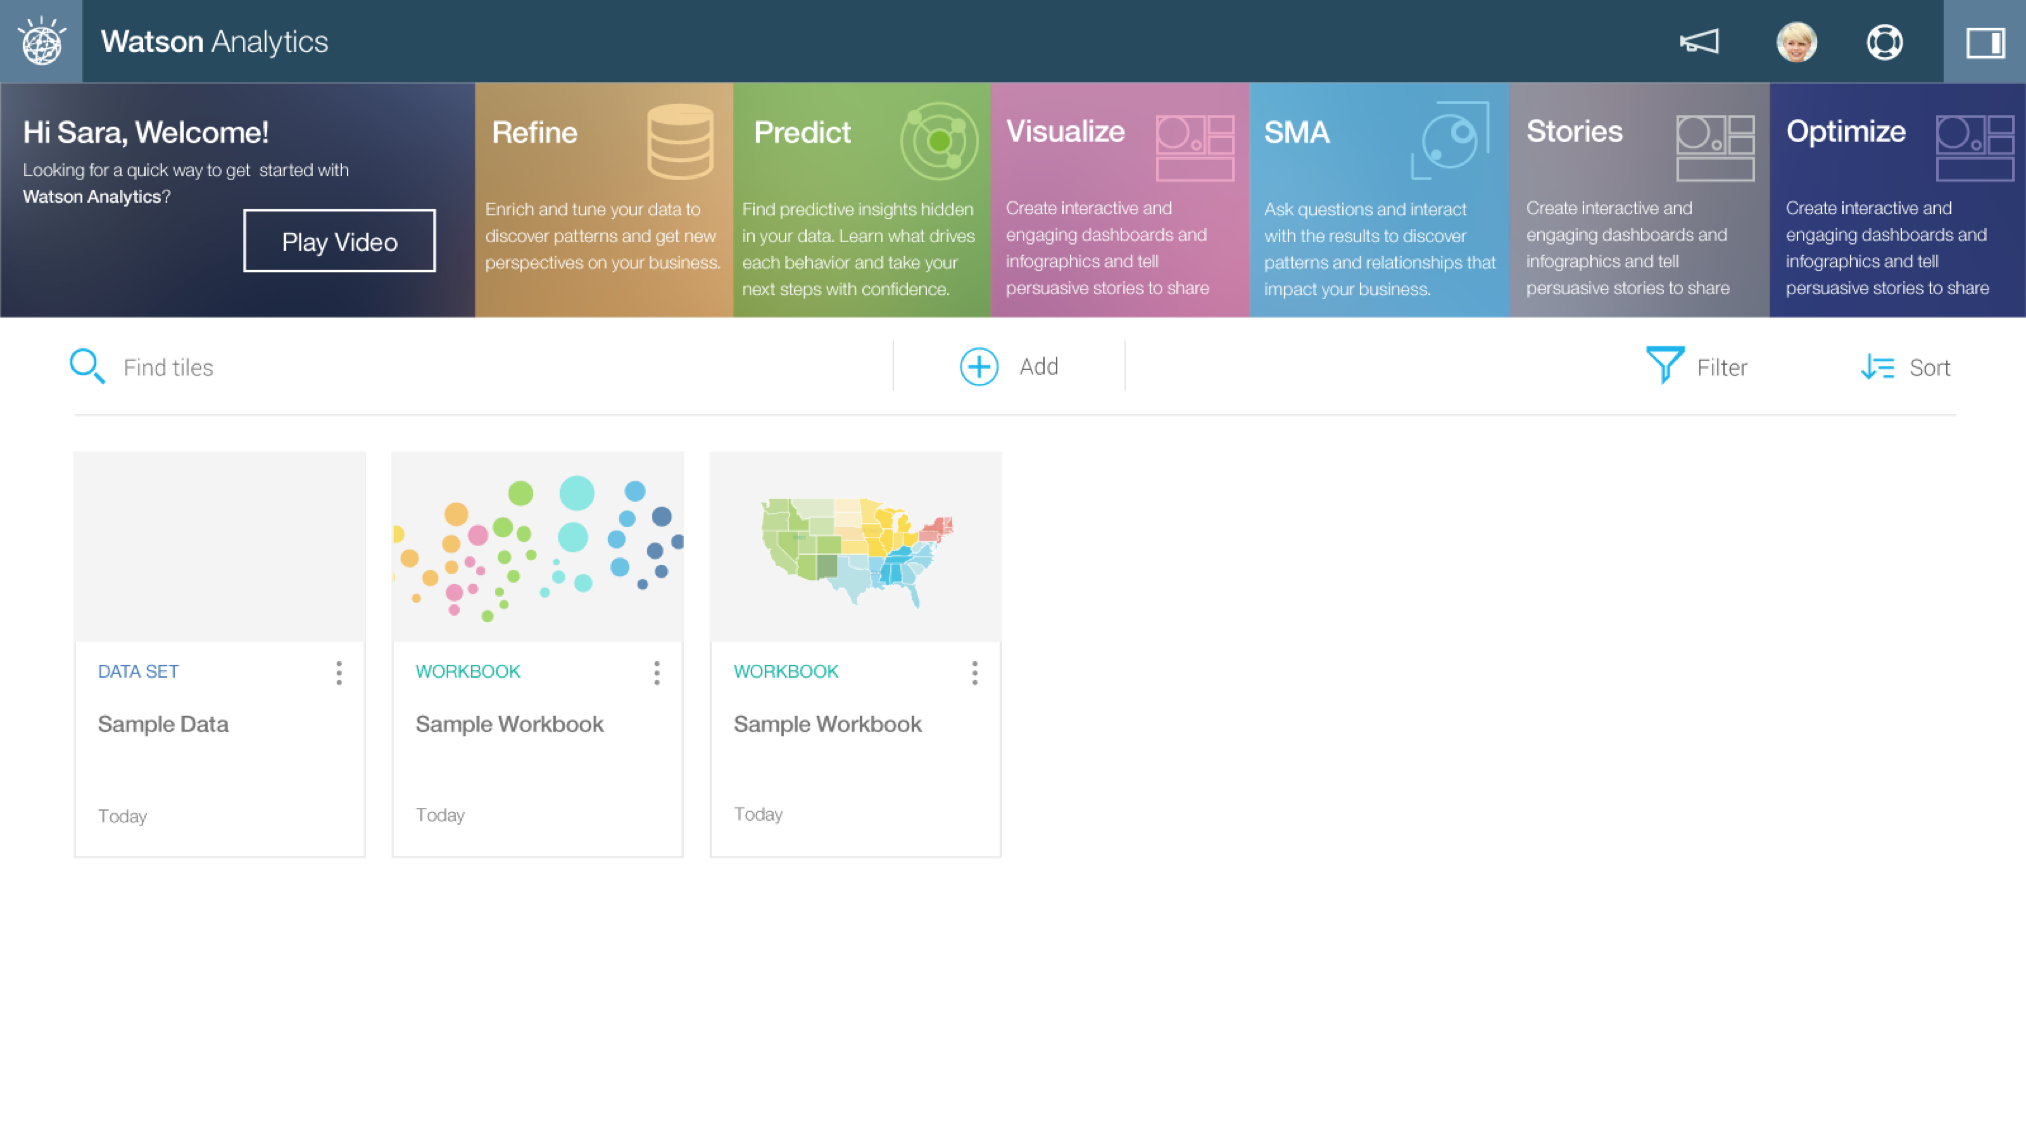
Final
Every two weeks we would meet with our sponsor users to review changes and get feedback, which really helped inform our quick design turnaround to have it live. After its announcement and release, the team was able to use these insights and my designs to move the product forward. They have since integrated Social Media Analytics, which I worked on prior to my time on Watson Analytics. See that work here.


outcomes
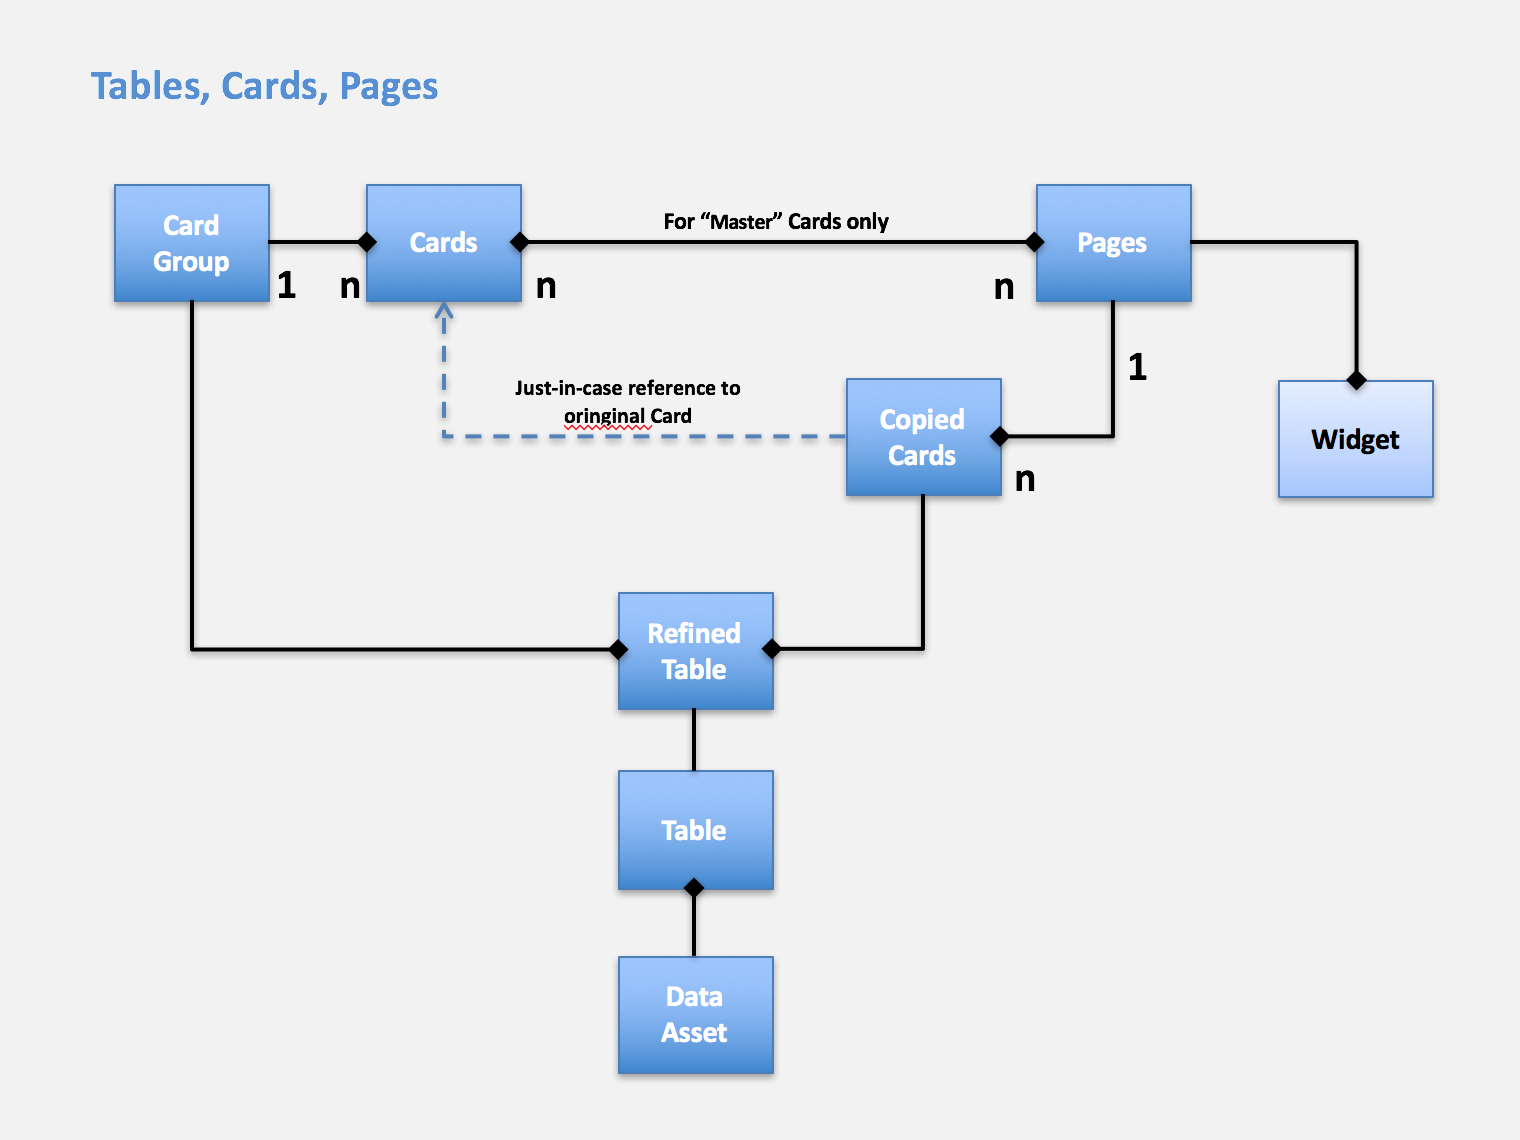
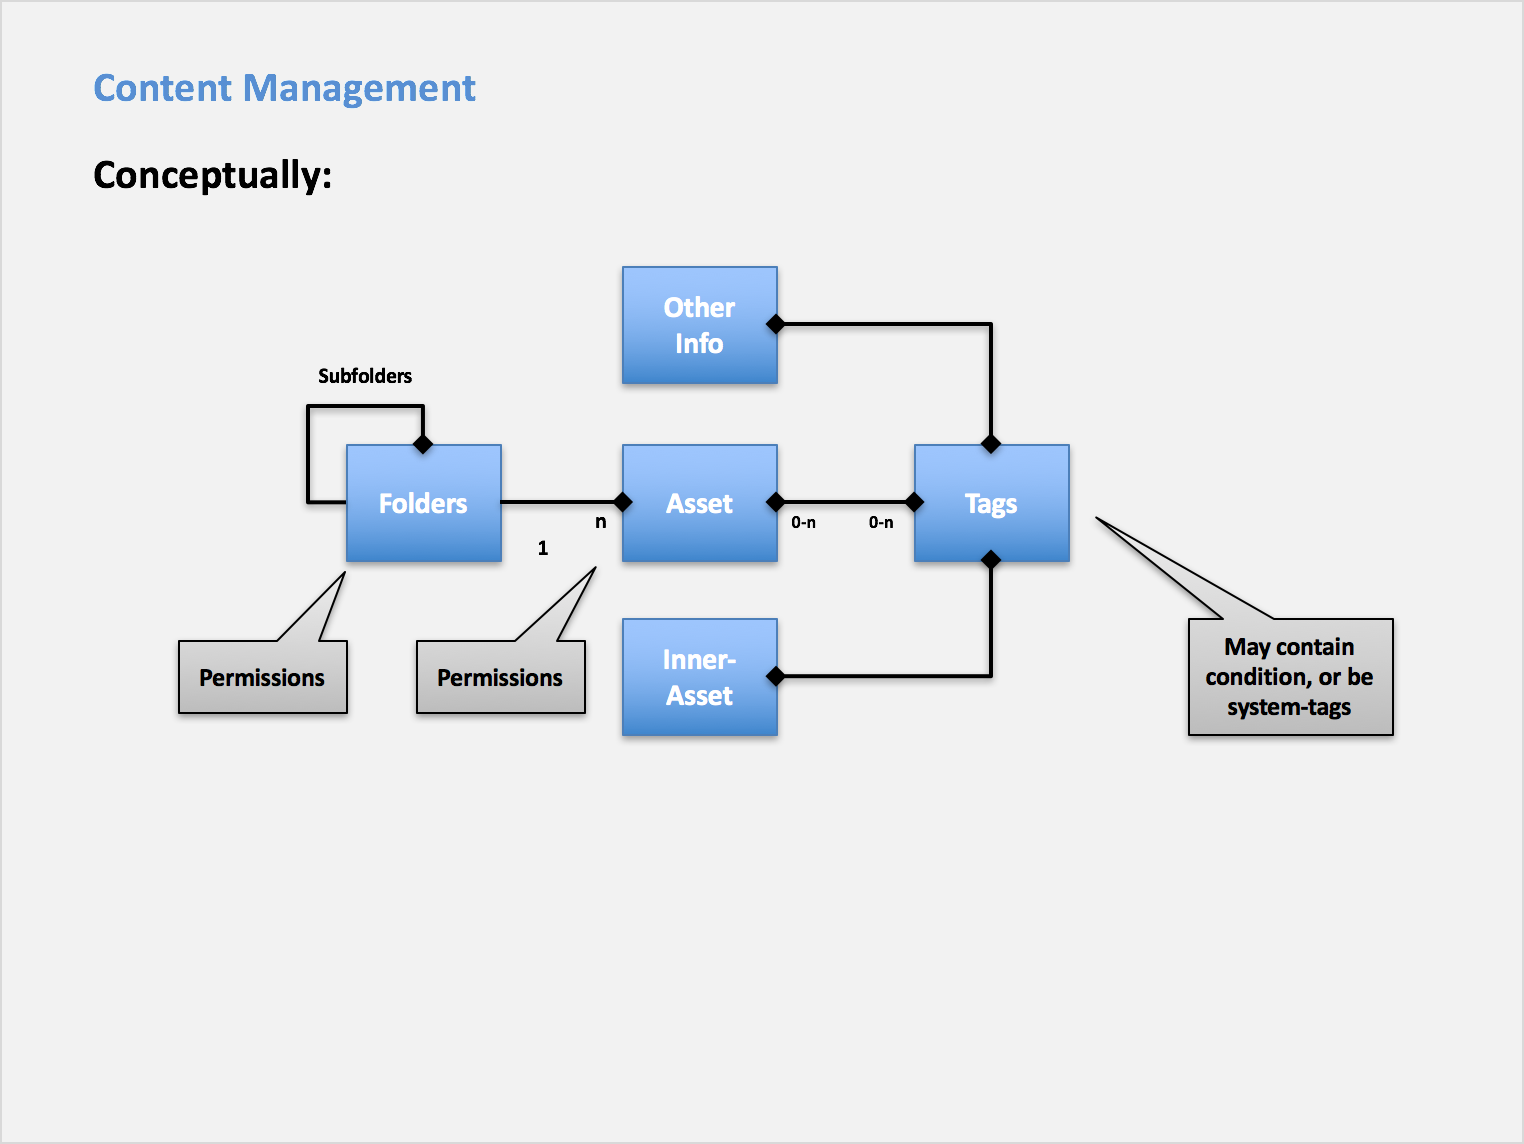
Underlying Data Structure
Through research we uncovered how users interact and report on data. With this knowledge the engineers on the team combined with the design team were able to create a data map for how the data were explored and created.
Persona understanding
Striking the balance between expert and novice data users proved itself to be challenging. But in the end, we figured out what tools to surface when to both the novice and expert and all of those in between, which provided a framework as new features were implemented over time.
Data Reporting Standards
As a goal of this project being to make data accessible for expert to novice users, we ended up with a set of interaction patterns that made exploring data intuitive and easy to build reports. These standards were used across other IBM products as they were successfully tested.
Remote team collaboration model
We traveled, we remote collaborated, and we figured out what meetings were and were not necessary to get our jobs done. The team was spread throughout Europe, Canada, and the US.